ModelGrade 7 · 7.RP.2a
Proportional or not? Graph and table explorer
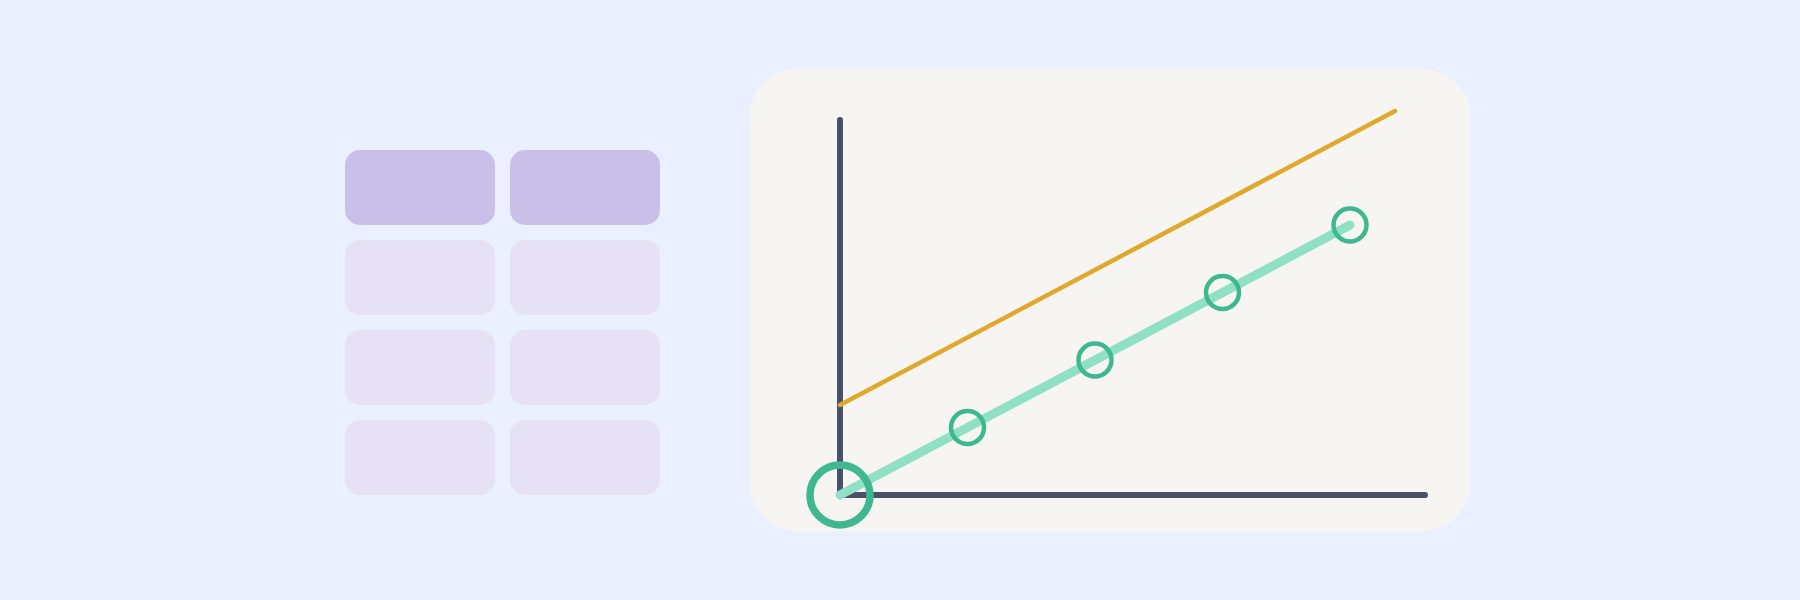
Plot tables, lay a ruler on graphs and test y ÷ x to decide whether two quantities are proportional.
Decide whether two quantities are proportional, using tables or a graph through the origin.
Summary in plain words; see the state framework for the official text.
Plot tables, lay a ruler on graphs and test y ÷ x to decide whether two quantities are proportional.

Find k in a table, plot points and decide if they are proportional, set a line to y = kx, match equations to graphs, read a unit rate from a graph, and explain what (0, 0) means.

A quick market game: spot the best buy by unit price, mix juice that tastes the same, and fill the gaps in ratio tables. Points for every right answer, a bonus for streaks.

Hang masses on a spring and measure how far it stretches. Find the pattern between the mass and the stretch in your own data.